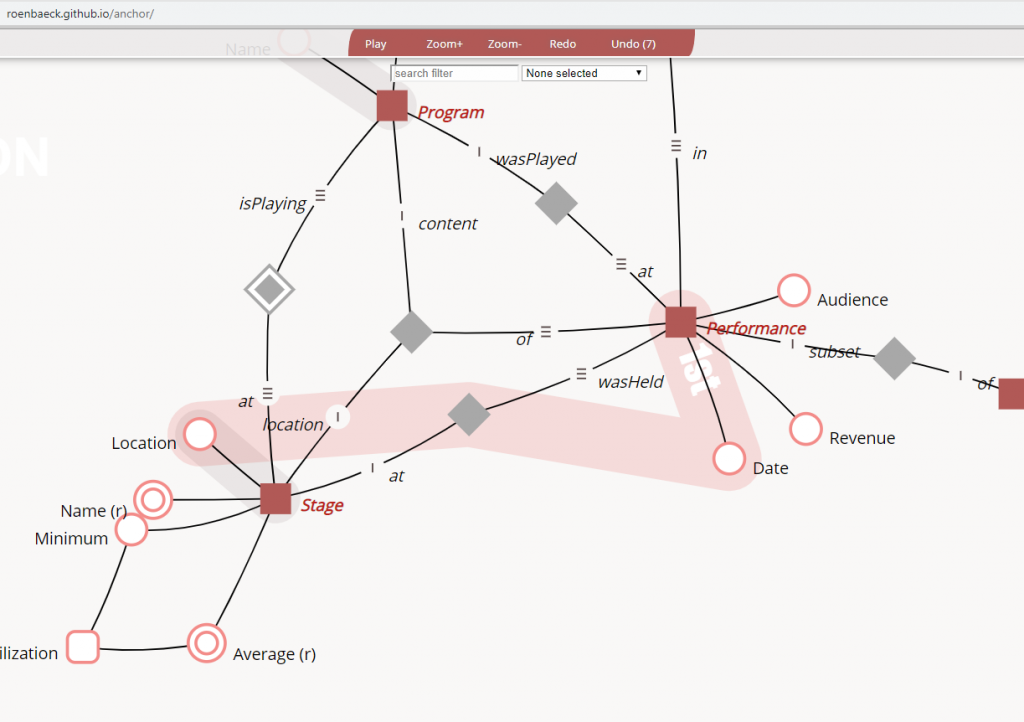
Visualization and editing of keys has been added in version 0.99.4 (test) of the free online Anchor modeling tool. This is so far only for informational purposes, but is of great help when creating your own automation scripts. Note that a key in an Anchor model behaves like a bus route, stopping on certain items in the graph. In order to create a key, select an anchor and at least one attribute (shift-clicking lets you do multiple select). To edit a created key, click on its grey route to highlight it red. You can then add or remove items or change it’s name. Click again to leave key editing mode. Along with this come some improvements to the metadata views in the database, and among them the new _Key view.