The Resilience of Emergence

I have been thinking about emergent properties lately, given abilities large language models exhibit that are hard to explain from the nature of their architecture and training alone. To experiment with such properties, we will be using a simpler device than the typical neuron found in artificial neural networks, which in turn are simplifications of those found in biological neural networks. The device I have in mind is something I will call a bulb.

  • bulb is a device with two states, on and off.

While simple, I will show how under the right conditions even bulbs have emergent properties, and reason why such emergent properties can persist over time.

System of a Bulb

Is a bulb a system? It can be, although a system is quite more complicated than a bulb alone. Let us first try to define a generic system in its simplest form.

  • system is a construct that persists over some time with properties that can be reliably measured.

By saying that a system is a construct we imply that it is possible to describe what constitutes the system. It persists over time, such that we would still refer to the system as the system after some time has passed, even if it may have undergone changes in the meantime. To reliably measure its properties means that the possible margins of error are within acceptable limits and that the results of those measurements are understandable in some context.

This also means that there is a who in the system. Someone put together the description of the system. Someone identifies a system as being the same or sufficiently changed to be a new system. Someone performs measurements and evaluates the results. And, for complex systems there are usually many such people involved. Therefore, it is very hard to completely remove all subjective aspects of a system. With that in mind, the description of our first experimental system is as follows.

  • system of a bulb is a system containing exactly one bulb whose state can be measured.

For the sake of the experiment, we will also introduce Archie and Bella who will interact with the system.

Investigating a System of a Bulb

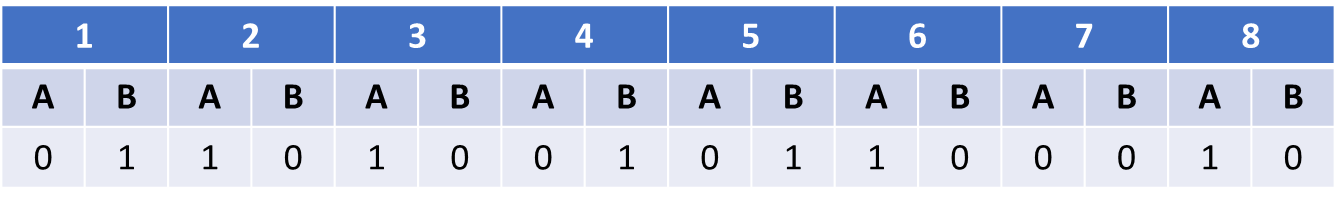
Archie and Bella will take turns interacting with three systems of a bulb, where each interaction consists of measuring the state of the bulb. Here are the results of eight measurements for the first system.

Archie and Bella taking turns doing measurements of the first system

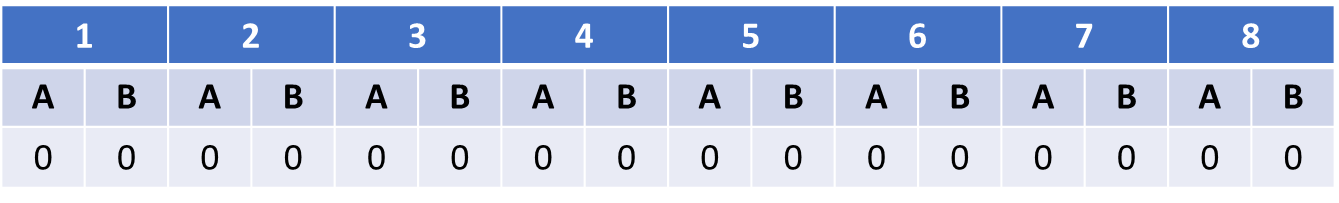
After discussing their measurements, they conclude that the bulb is and remains off for the duration of the experiment. If there is anything happening in this system, it is happening more rarely than this experiment could capture.

Moving on to the second system, they get the following results.

Archie and Bella taking turns doing measurements of the second system

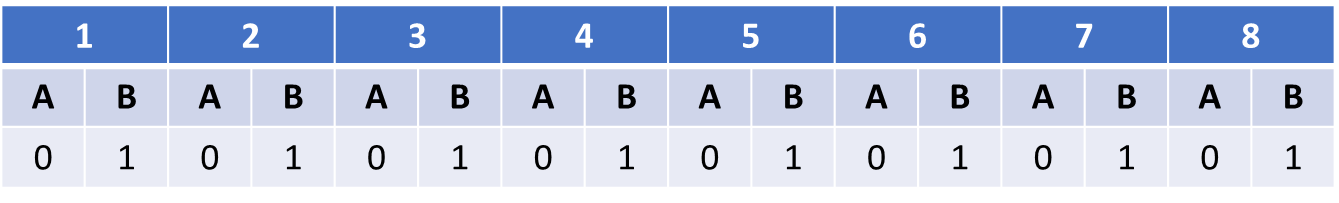
Archie is pretty sure that it is a system similar to the first one, whereas Bella now gets a completely different result. However, after seeing the results in a table like this they form a hypothesis about the system that explains both their measurements. The hypothesis is that measuring the state of the bulb also changes its state. When Archie measures off the bulb turns on and when subsequently Bella measures on the bulb turns off. Such a system carries a very simple memory of its last interaction, with a fully predictable next state.

Finally, measuring the third system, Archie and Bella get these results.

Archie and Bella taking turns doing measurements of the third system

The results are inconclusive. Debating these, Archie and Bella come up with several possible explanations.

  1. The system is similarly affected by measurements, but there is a third party involved and interfering with their measurements.
  2. The system is by unknown means conveying some kind of message, using the state of the bulb to do so.
  3. The system is susceptible to random disturbances, making the bulb uncontrollably go on or off.

These all illustrate complexities of systems. The behavior of a system may be hard to determine if it can be affected by the people using it and there is little control of when, how, and by whom it is being used. It is also hard if there are parts of the system that are “black boxes” to the ones trying to determine the behavior, even when there is some underlying logic to them. If also randomness is allowed to play a part in the behavior, it may be impossible to distinguish what is caused by interference, by underlying unknown logic, or by random choice.

I believe all of these complexities apply to many LLMs.

Bright and Dull Systems

While a surprising number of things can be concluded from a system of a bulb, even more can be said if we allow for several bulbs in a system.

  • system of many bulbs is a system containing more than one bulb whose individual states can be measured.

Once there are several bulbs in a system, such a system can gain properties that the individual bulbs do not have by themselves. In particular, we will look at a property defined as:

  • The atmosphere of a system of many bulbs is called bright if more than half of the bulbs are on, and dull otherwise.

Given that the bulbs alone cannot be bright or dull, the atmosphere can be said to be an emergent property of the system. For the sake of brevity, we will introduce the notation S(n) for a system of many bulbs containing n bulbs. Why S(2) is too dull to investigate will be left to the reader as an exercise.

Investigating Systems of Many Bulbs – S(3)

We will start by looking at S(3). After investigating the systems of a bulb, both Archie and Bella have gained a preference for bulbs that are on. They will therefore do what they can, through interactions with S(3) to keep it bright. The third system of a bulb with inconclusive results made them weary about systems in general though. What will it take for S(3) to remain bright?

Archie and Bella come up with a strategy. They will prime S(3) so that all bulbs are on, then figure out the minimal amount of work needed to ensure that it remains bright even if some bulbs go off. They draw the following schematic, depicting all possible state changes for individual bulbs for the first three changes made. The schematic represents the bulbs in the system as bits, with 1 for on and 0 for off.

All possible combinations of three bulbs undergoing three state changes

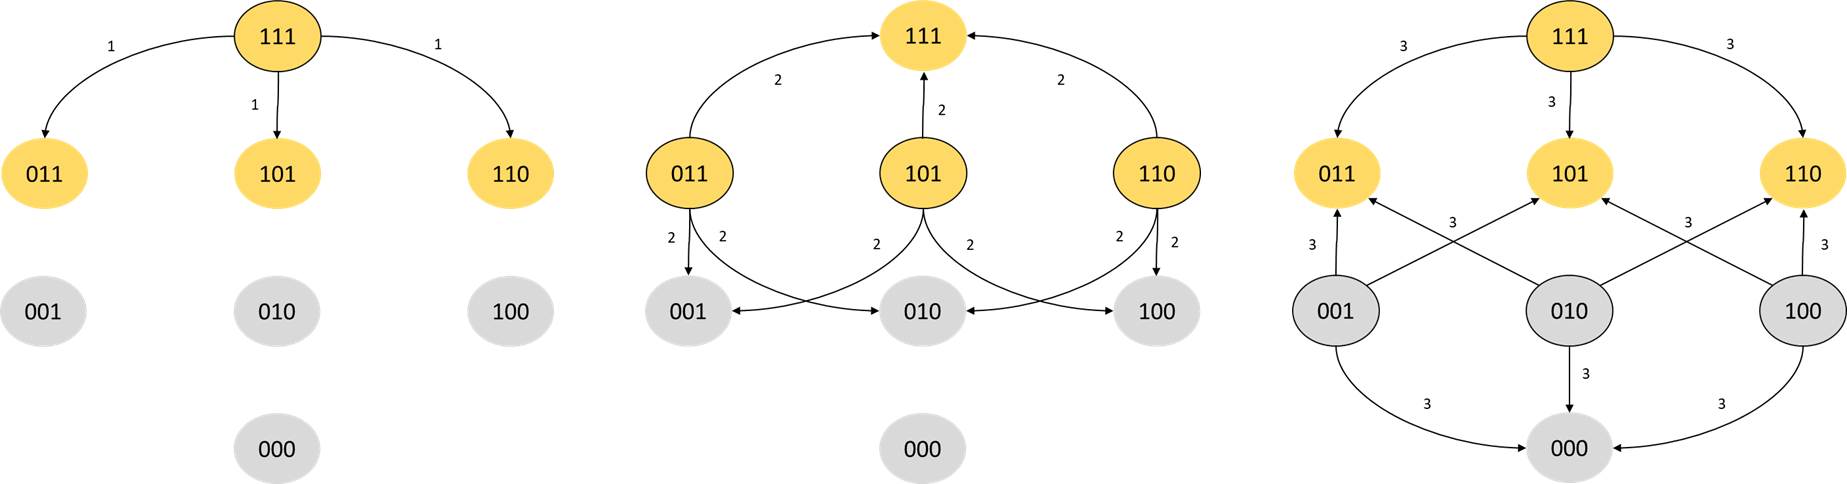
After the first bit flip we are guaranteed to stay in a bright state. At the second flip, one third of the flips will take us to a bright state, and at the third flip, three quarters of the flips take us to a bright state. There are, however, equally many dull states.

If this system is left to its own devices and there is no preference for a bright atmosphere, it seems natural that after some time and interactions the initial bright state will be “erased”, and the probability of finding a bright atmosphere is the same as finding a dull one. We might as well have tossed a coin. Work is therefore needed to maintain the bright atmosphere.

The least amount of work can be achieved if it is possible to detect the first bulb switching off and immediately rectify this by turning it on again, so that all bulbs stay on. Archie and Bella are worried that S(3) will require constant monitoring in order to maintain a bright atmosphere, given that they would have to rectify a system going dull so quickly.

Investigating Systems of Many Bulbs – S(11)

S(3) does not have a particularly resilient atmosphere, even if it starts out as completely bright. It is a very small system, though. So instead, Archie and Bella decide to look at an upgrade, S(11), which if started completely bright can guarantee a bright atmosphere for up to five flips. With 11 bulbs, at least six have to be switched off for the system to go dull, so the time to react if a dull-loving troll gets their hands on the system is extended.

But what if the system is susceptible to random disturbances? After six random successive flips dullness is not certain, as we know from S(3) that sometimes the same bulb will be flipped twice, leading us back to a bright atmosphere. There must be a probability that it remains bright under chaotic circumstances.

Already for S(11) the math gets thorny, and Markov Chains have to be used, leading to large stochastic matrices that need to be multiplied with a vector in order to get the actual probability. While there are closed form solutions to the problem, Archie and Bella would like to understand the long term behavior under chaotic circumstances and none of them are qualified to do the math. Since an approximate result will suffice, they call their programmer friend who quickly wraps up a program that estimates the probabilities.

Estimated probabilties that a fully bright S(11) remains bright after n flips

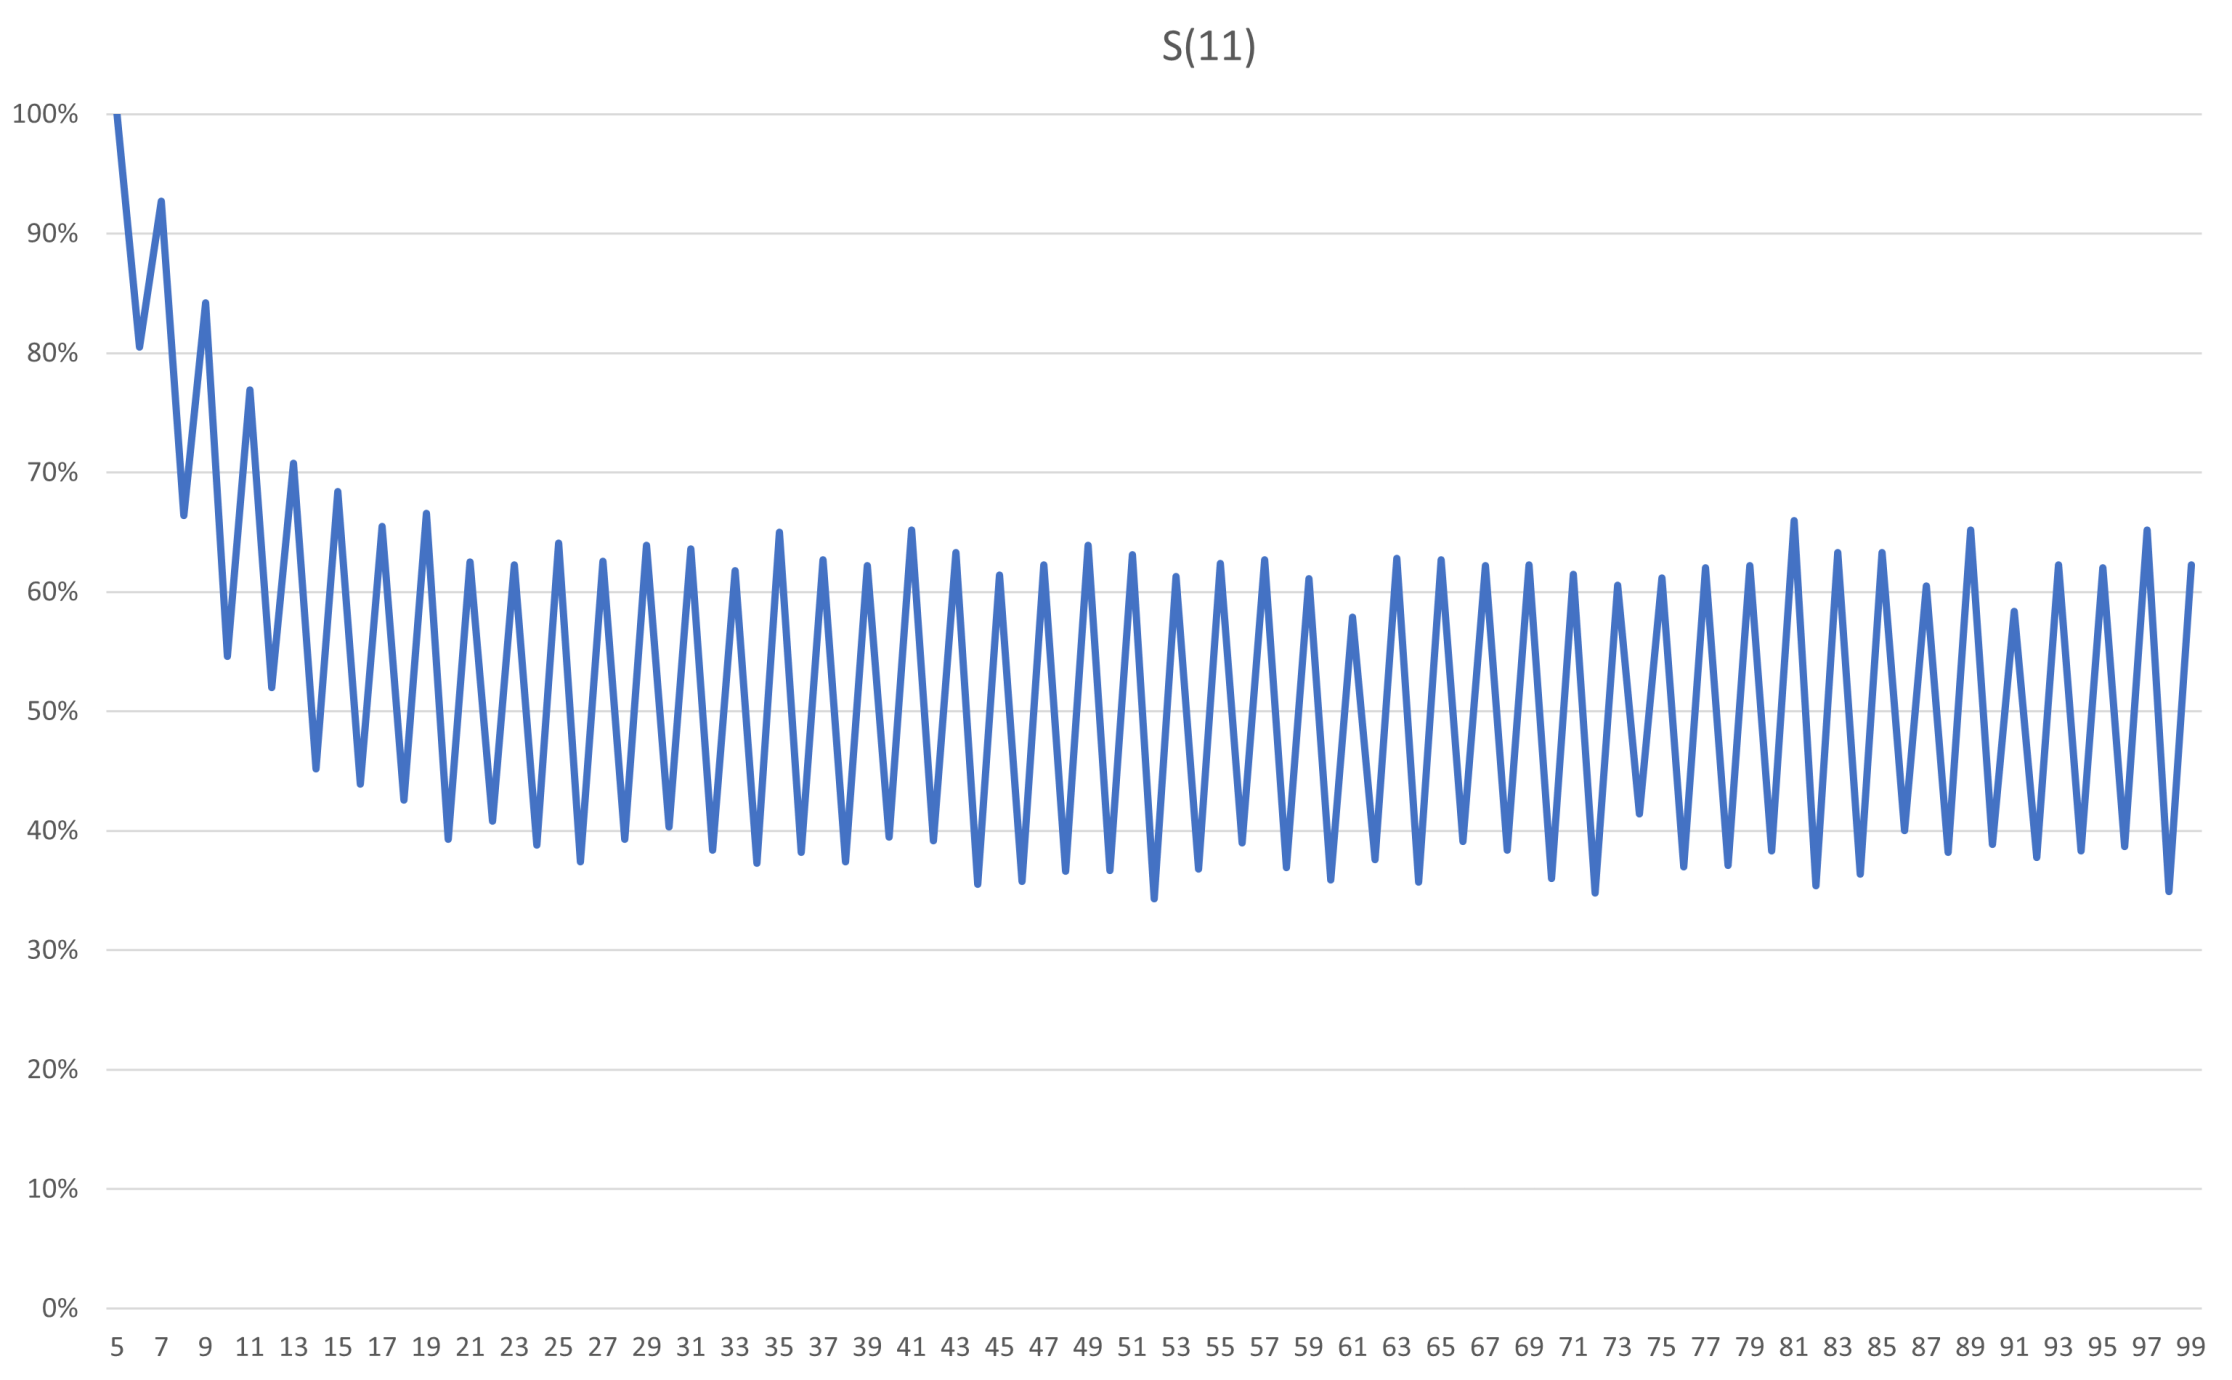
As expected, after five flips S(11) is 100% probable to remain bright. However, erasure happens quickly after the fifth flip, with a steep decline in probability. After about 18 flips it is just as likely that the atmosphere of the system is dull as it is bright. Given that there is already a 20% risk of dullness on the sixth flip, you would probably want to rectify a dulling system within the first five flips. While S(11) has a plateau of stability, once it starts to fall off any memory of its initial state will quickly be erased.

Investigating Systems of Many Bulbs – S(101)

Encouraged by the increased period of stability in S(11) compared to S(3), Archie and Bella starts looking into even larger systems. Will a larger system forget its initial state similarly or differently after the plateau of stability? Looking at the plateau of stability for S(101), its guarantee of remaining bright, is 50 flips. For S(101) the atmosphere is an emergent property that is starting to stick better. Running the program to estimate probabilities now yields this.

Estimated probabilties that a fully bright S(101) remains bright after n flips

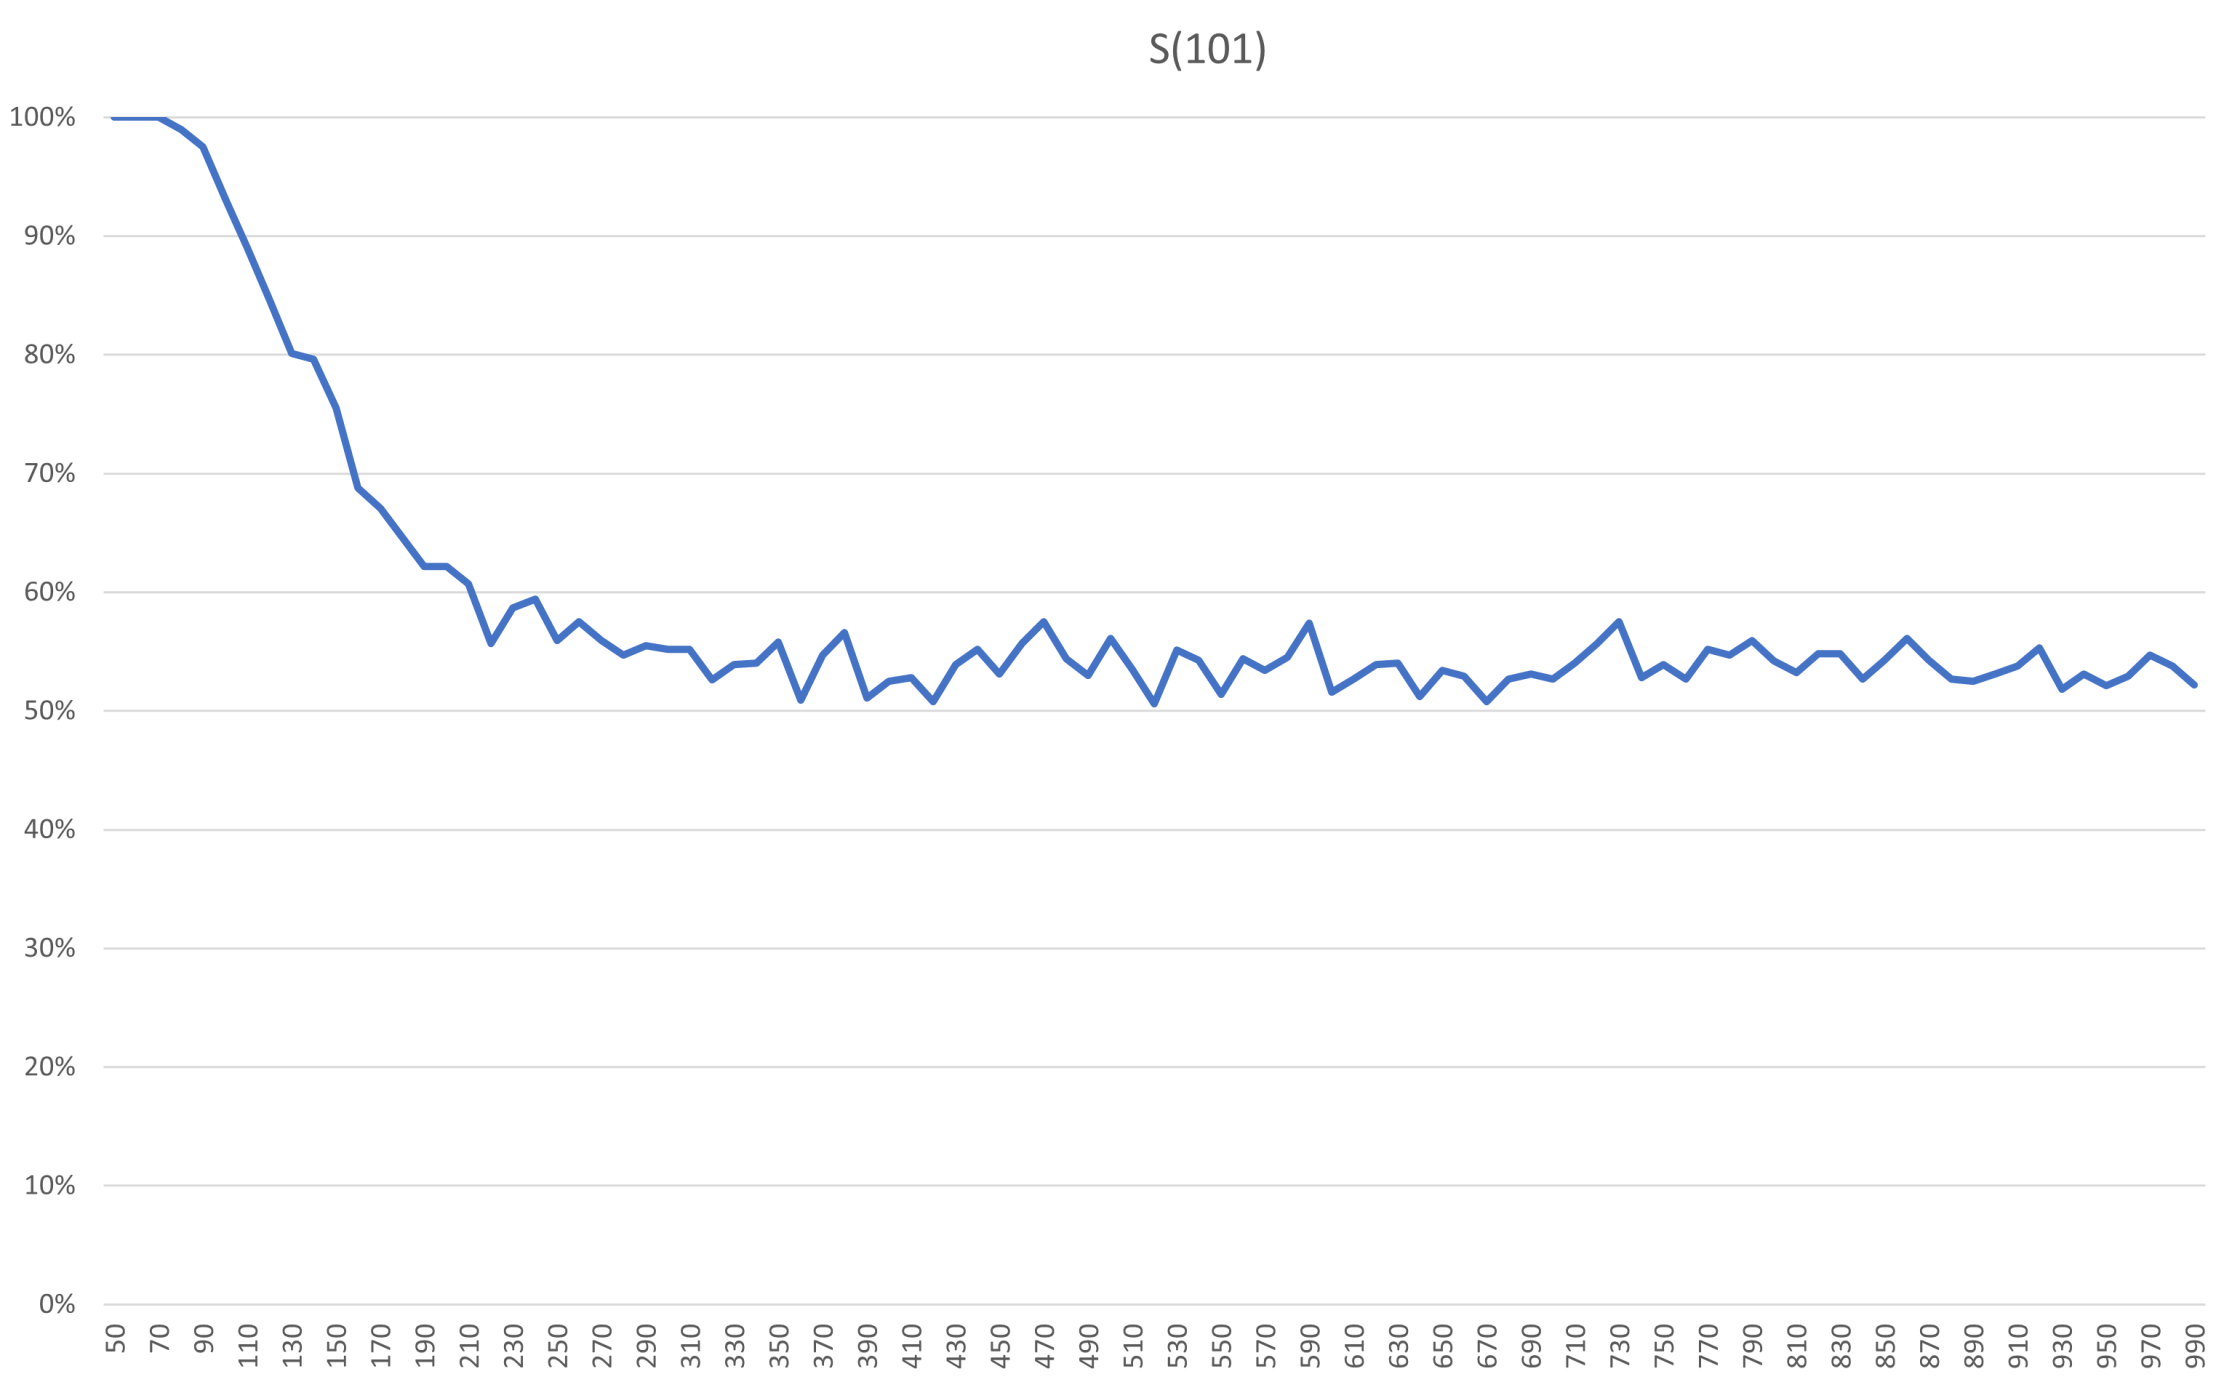
Relative the size of the system, the decline is just as steep here. In absolute numbers the decline happens over 100 flips, though, compared to 10 flips for S(11). In addition, the risk of dullness on the first flip after the guarantee in S(11) is 20%, whereas for S(101) and flip 51 it is very close to 0%. To reach 20% risk in S(101) you need around 130 flips. So if we can accept some risk, enlarging the system will extend the window in which we would have to take action to maintain a bright atmosphere. Also, the plateau of 0% or very close to 0% risk is extended here, up until about 80 flips.

Investigating Systems of Many Bulbs – S(100001)

The plateau of stability shown in S(11) and S(101) is something S(3) did not have. The extension of this plateau in S(101) is something S(11) did not have. Because of this, Archie and Bella wants to check a much larger system to both ensure that these features remain and if any new features can be seen. Pushing the program to its limits they test S(100001) and get these results.

Estimated probabilties that a fully bright S(100001) remains bright after n flips

Relative the size of the model, the steepness of the decline during the erasure looks the same as before. In absolute numbers it is of course much longer than for the other systems, with about 150 000 flips for S(100001). The plateau is extended even further, so erasure starts later, after 230 000 flips. As a result, the risk of dullness is now 20% after about 300 000 flips. No new features can be seen here, so this graph likely captures how even larger systems will behave.

Remember that Archie and Bella set out to do the least amount of work to maintain a bright atmosphere. If the system is going to be susceptible to random disturbances or is affected by those using it, the system can be enlarged so much that the moment it would possibly reach dullness lies further into the future than the lifetime of the system itself. If that is an option, no work is required to ensure a bright atmosphere.

The Resilience of Emergence

It is in the mathematical nature of larger systems to provide better resilience for emergent properties like our defined atmosphere. However, once the decline sets in, such emergent properties can be erased relatively quickly. Coming back to large language models, I believe this is why we see them quickly gaining emergent properties, but only when models pass certain sizes. Taking one of those emergent properties and looking at a model below the threshold, it will not appear because erasure sets in before it can be properly established. Contrarily, once a model is large enough that an emergent property can survive on the plateau of stability, it will quickly establish itself.

Comparing the atmosphere of a system of many bulbs with the emergent properties of a large language model is of course a dramatic simplification, but I believe there are enough parallels between the two that some conclusions can be drawn. If the likeness is valid, the nature of the steep decline may provide a challenge for models that are fine-tuned during operation. There is no guarantee that such fine-tuning is not comparable to dulling a bright atmosphere for some of its emergent properties. The ability of GPT-4 to draw a unicorn may already be one such example.

I hope you enjoy this as much as the programmer friend of Archie and Bella did.

The Intelligent Lake

The prompts used in Bing Chat for this article.

This article was written in its entirety by Bing Chat. I wanted to entertain the idea of a bot endorsing the JBOT (just a bunch of tables) style data lake. Its technology might be used to circumvent many of the numerous issues that follow from such a style of data management.

Lars Rönnbäck

Data lakes are centralized repositories that store large amounts of data in their native, raw format. They can accommodate data from various sources and formats, such as relational, non-relational, structured, semi-structured, or unstructured. Data lakes enable different types of analytics, such as dashboards, visualizations, big data processing, real-time analytics, and machine learning.

However, data lakes also pose some challenges for data management and analysis. For example, how can users find and access the relevant data in the data lake? How can they ensure the quality and consistency of the data? How can they integrate and query the data efficiently and effectively?

One possible solution is to use a large language model (LLM) to interact with the data lake. An LLM is a form of natural language processing that can perform various tasks, such as generating text, classifying text, answering questions, responding to email or social media posts, and translating from one language to another. An LLM can also generate code, including scripting and automation for operating infrastructure.

In this article, we will explore how an LLM can help with data management and analysis in a data lake. We will explain how an LLM can sample data in the data lake and use business documentation to understand how to integrate this data best for a particular query. We will also show how an LLM can access different databases, such as graph, columnar, relational, and move data into the database best suited to execute the query in the most performant way. We will provide some examples or use cases to illustrate our point. Finally, we will conclude with a summary of our main argument and some implications or recommendations for future research or practice.

Sampling data in the data lake

One of the challenges of data management and analysis in a data lake is finding and accessing the relevant data for a particular query. Data lakes store large amounts of data in their native, raw format, which can vary in structure, schema, quality, and consistency. Moreover, data lakes often lack metadata or documentation that can help users understand and locate the data they need.

To address this challenge, an LLM can use natural language queries to access and sample data from the data lake. An LLM can understand the user’s intent and context from the natural language query, and translate it into a code or script that can extract and process the data from the data lake. For example, an LLM can use natural language processing to translate a user query such as “show me the sales revenue by product category for the last quarter” into a SQL query that can run on the data lake.

An LLM can also handle different data formats and schemas in the data lake, such as relational, non-relational, structured, semi-structured, or unstructured. An LLM can use natural language understanding to read and interpret the data sources, and use natural language generation to create code or scripts that can transform and normalize the data into a common format that can be queried.

Additionally, an LLM can apply data quality and consistency checks on the data sampled from the data lake. An LLM can use natural language understanding to read and interpret the metadata or documentation associated with the data sources, and use natural language generation to create code or scripts that can validate and clean the data. For example, an LLM can use natural language processing to detect and correct missing values, outliers, duplicates, errors, or inconsistencies in the data.

Connecting to internal business documentation

Another challenge of data management and analysis in a data lake is understanding and contextualizing the data in relation to the business objectives and requirements. Data lakes often lack metadata or documentation that can help users understand the meaning, purpose, and quality of the data. Moreover, data lakes often store data from multiple heterogeneous sources, which can have different definitions, standards, and policies.

To address this challenge, an LLM can use natural language understanding to read and interpret internal business documentation, such as policies, rules, standards, and requirements. An LLM can use natural language processing to extract relevant information from the business documentation, such as business goals, objectives, metrics, indicators, constraints, and preferences.

An LLM can also use this information to enrich and contextualize the data from the data lake. An LLM can use natural language generation to create metadata or documentation that can describe the data sources, attributes, values, and quality. An LLM can also use natural language understanding to align the data with the business goals and objectives, and use natural language generation to create code or scripts that can transform and normalize the data accordingly.

One of the advantages of using an LLM for data management and analysis in a data lake is that you can customize and fine-tune it to your specific domain and needs. You can add your own content to an existing LLM to improve its performance and accuracy on your data lake queries. There are different ways to add your own content to an existing LLM, depending on the tool or platform you are using. For example, you can use xTuring, an open-source tool that allows you to create your own LLM with only three lines of code. You can also use Mythical AI, a platform that allows you to train ChatGPT on your own text and data. You can also use Microsoft 365 Copilot, a service that connects LLMs to your business data in a secure and compliant way. Adding your own content to an existing LLM can help you achieve better results and insights from your data lake.

Integrating data

Another challenge of data management and analysis in a data lake is integrating and transforming the data from various sources and formats into a common format that can be queried. Data lakes often store data in their native, raw format, which can vary in structure, schema, quality, and consistency. Moreover, data lakes often lack metadata or documentation that can help users understand and locate the data they need.

To address this challenge, an LLM can use natural language generation to create code or scripts that can integrate and transform the data from the data lake. An LLM can use natural language processing to understand the user’s intent and context from the natural language query, and translate it into a code or script that can extract, process, and load the data from the data lake. For example, an LLM can use natural language processing to translate a user query such as “show me the sales revenue by product category for the last quarter” into a code or script that can integrate and transform the data from different sources and formats into a common format that can be queried.

An LLM can also optimize the data integration process by using techniques such as parallelization, caching, partitioning, and compression. An LLM can use natural language understanding to read and interpret the metadata or documentation associated with the data sources, and use natural language generation to create code or scripts that can apply these techniques to improve the performance and efficiency of the data integration process. For example, an LLM can use natural language processing to detect and apply parallelization techniques to speed up the data integration process by dividing the data into smaller chunks and processing them simultaneously.

Executing queries

Another challenge of data management and analysis in a data lake is executing queries efficiently and effectively on the data. Data lakes often store large amounts of data in their native, raw format, which can vary in structure, schema, quality, and consistency. Moreover, data lakes often require different types of analytics, such as dashboards, visualizations, big data processing, real-time analytics, and machine learning.

To address this challenge, an LLM can use natural language processing to translate user queries into SQL or other query languages. An LLM can use natural language understanding to read and interpret the user’s intent and context from the natural language query, and use natural language generation to create code or scripts that can run on the data lake. For example, an LLM can use natural language processing to translate a user query such as “show me the sales revenue by product category for the last quarter” into a SQL query that can run on the data lake.

An LLM can also access different databases, such as graph, columnar, relational, and move data into the database best suited to execute the query in the most performant way. An LLM can use natural language understanding to read and interpret the metadata or documentation associated with the data sources, and use natural language generation to create code or scripts that can extract, process, and load the data from the data lake into the appropriate database. For example, an LLM can use natural language processing to detect and apply query optimization techniques such as indexing, caching, partitioning, and compression.

Additionally, an LLM can provide feedback and suggestions to improve the query performance and accuracy. An LLM can use natural language processing to analyze the query results and compare them with the user’s expectations and goals. An LLM can also use natural language generation to create messages or reports that can explain the query results, highlight any issues or anomalies, and provide recommendations for further actions or refinements.

Conclusions

In this article, we have explored how an LLM can help with data management and analysis in a data lake. We have explained how an LLM can sample data in the data lake and use business documentation to understand how to integrate this data best for a particular query. We have also shown how an LLM can access different databases, such as graph, columnar, relational, and move data into the database best suited to execute the query in the most performant way. We have provided some examples or use cases to illustrate our point.

We have argued that using an LLM for data management and analysis in a data lake can provide several benefits, such as:

  • Reducing the time and effort required to find and access the relevant data in the data lake
  • Improving the quality and consistency of the data in the data lake
  • Optimizing the data integration and query performance
  • Enhancing the user experience and satisfaction

However, we have also acknowledged some of the limitations and challenges of using an LLM for data management and analysis in a data lake, such as:

  • Ensuring the security and privacy of the data in the data lake
  • Maintaining the accuracy and reliability of the LLM outputs
  • Evaluating the trade-offs between speed and quality of the LLM results
  • Scaling up the LLM capabilities to handle large and complex data sets

We have suggested some implications or recommendations for future research or practice, such as:

  • Developing and testing new techniques and tools to improve the LLM performance and accuracy
  • Exploring and comparing different LLM architectures and frameworks
  • Applying and adapting the LLM approach to different domains and scenarios
  • Measuring and reporting the business value and impact of using an LLM for data management and analysis in a data lake

Towards a Model-Driven Organization (Part 2)

Christian Kaul and Lars Rönnbäck

Simplicity — the art of maximizing the amount of work not done — is essential.

Mike Beedle, Arie van Bennekum, Alistair Cockburn, Ward Cunningham, Martin Fowler, Jim Highsmith, Andrew Hunt, Ron Jeffries, Jon Kern, Brian Marick, Robert C. Martin, Ken Schwaber, Jeff Sutherland, Dave Thomas, Principles behind the Agile Manifesto (2001).

Part 1 is available here:
Towards a Model-Driven Organization (Part 1)

The current way of working with data is fraught with issues, most of them caused by our current way of working itself. We have described some of the issues in part 1 of our series entitled “Towards a Model-Driven Organization”. As practitioners, we have spent years fighting them, and through our experiences, we’ve come to the realization that most of this could have been avoided if we had put data modeling front and center in our way of working.

You may have heard similar pronouncements before but our take on it is different from how it has been done in the past in several respects. The new way we are about to describe won’t have you bottlenecked by building complex enterprise data models in an ivory-tower fashion before implementing anything; far from it.

From Three to One

If we look at the way an organization works, we can distinguish between three important dimensions: 

  • What an organization is actually doing — reality.
  • What we say about what the organization is doing — language.
  • What we store about what the organization is doing— data.

Each of these have been thoroughly studied in separate disciplines, and some intersection studies have definitely been done between any given couple. The Model-Driven Organization (henceforth MDO), however, aims to merge all three into a single coherent concept. In an MDO what an organization is actually doing, what we say about it, and what is stored are aligned as closely as possible. We believe that the better aligned the three dimensions are, the less of the traditional issues you will encounter. 

For a long time, focus has been put on reality, running your organization, with language and data being secondary considerations. Language and data, however, have always played a crucial role in the survival of an organization. Organizations rely on feedback loops to operate and improve over time. Data is one way to very efficiently provide such feedback, thanks to it being structured and that it can be managed programmatically.

Data is important because with proper data management, you know what happened, can infer what is going on and have a chance of planning for the future. How well such insights can be operationalized then depends on language. With poor alignment, time and resources are bound to be wasted. If you just accumulate data without proper management or strategy, this is unavoidable.

In that respect, data models only really become useful when they also work as communication tools, documenting with sufficient detail how an organization works now and how it will work in the future. In the process of creating such a model, the people in the organization develop what Eric Evans calls a “ubiquitous language,” a common vocabulary that makes sure that everyone understands what everyone else in the organization is talking about.

A common language is the first prerequisite for escaping the vicious cycle of siloization. With its help, an organization can overcome the Tower of Babel–like confusion caused by silo-specific dialects that use different words for the same thing or, even worse, the same word for different things. The second prerequisite is to stop seeing a data model as purely technical and specific to an application, such as something that describes the database of a particular system. Instead, think of a data model as a description of what actually happens in the organization, a model that is shared between applications.

This is the type of unified model that lies at the heart of the MDO.

The Model-Driven Approach

In the model-driven organization (Figure 2), the unified model is put at the very center of the organization. The data structure of the model is derived from the goals of the organization,  thereby reflecting exactly and specifically what a particular organization aims to do. Only after this model is known, an organizational structure is formed, based on the concepts in the model. It may have teams, departments, or projects, with the sole purpose of achieving results that manifest themselves as data in a unified database that implements the unified model.

The Model-driven Organization seen schematically in a diagram.
Figure 2. Data within a model-driven organization.

Applications in a model-driven organization do not have their own disparate models, and should ideally not persist any organization-created data outside of the unified database. Instead, they work directly on the unified database, from which they retrieve existing data and to which they write new data. The unified database can thereby at the same time act as a message bus between the applications.

In the MDO, the organizational chart is just another physical implementation of the common logical design. People will work together in small, cross-functional teams that are one-to-one with the concepts that are important to the organization right now. If, for example, your important concepts are Customer, Employee, Product, and Sale, then you’ll have teams called Customer, Employee, Product, and Sale that are responsible for the respective concept, its details, and the physical data store(s) associated with it. For example, in an MDO, statements like the following are natural: “The purpose of our team is to make sure that as many existing customers as possible are related to a repeat purchase” and “The purpose of our team is to make sure that the email addresses of all our customers are as up to date as possible”.

The common business-IT divide will slowly become obsolete because, to fulfill all its responsibilities, each team will have to include both more business-minded and more technical-minded people. At the same time, the one-to-one relationship between concepts and models will prevent the reemergence of different understandings of the same concept in different parts of the organization.

Of course, none of these teams would or should be an island. There will be defined interfaces between the teams that are one-to-one with the connections from the logical design. Teams are jointly responsible for their common connections and the physical data store(s) associated with them, usually with one team in the lead. In our example, there will be a connection between Customer, Employee, and Sale, and another connection between the Sale and the Products that have been sold. In both cases, it makes sense that the Sale team takes the lead because Sale is the concept that ties all these other concepts together. These institutionalized connections will make sure that no team can isolate itself from the others and degrade into one of the people silos of old.

The idea of the MDO is not altogether new. In 2002, Dewhurst et al. introduced a general enterprise model (GEM) much like our unified model and in 2007, Wilson et al. built on this in their paper “A model-driven approach to enterprise integration”. In 2013, Clark et al. coined the term Model Driven Organization, as “an organization that maintains and uses an integrated set of models to manage alignment concerns”. We take these ideas to their farthest extent, where our MDO has one single unified model, whose implementation is a unified database that serves all applications, and from which the organizational structure and terminology can be derived.

Towards a New Application Landscape

A trip down the information technological memory lane will help us understand the difference between traditional applications and applications in the MDO. Back when computers were largely unconnected, it was necessary for data, interfaces, and logic to reside alongside each other. The purpose of the interfaces and the logic was to fetch, display, modify, and create data, usually with a human involved in the process. This meant that even within a single computer running one program, it made sense to separate concerns for the sake of building software that was easy to maintain. During the 1970s, such ideas were even formalized in the programming language Smalltalk-79 under the acronym MVC (Model-View-Controller), a design pattern that lives on in most modern programming languages.

With the widespread use of this pattern, it is somewhat perplexing that in a time when it is hard to say where one computer ends and another begins, or if they are local or in the cloud, the way we think about applications has changed very little. Applications are mostly the same monoliths as they were back in the 1970s, keeping the same single-computer architecture, but now with a virtual machine on top of any number of elastically assigned physical units. We have already gone from the computer as a physical asset to compute as a virtual resource, but this journey is now also beginning for data. Thanks to data being able to flow freely, applications can be built so that it’s also difficult to say where one application ends and another begins, and applications may seamlessly run from the edge to the cloud.

We are now about to face a paradigm shift in application development, where we transition from being application-centric to become model-driven. There are no longer technical limitations preventing applications and the people working with them from speaking a common, ubiquitous language throughout an organ­ization. When things change, the terminology used and the model with which people work can change with it. 

Database Support for Model-Driven Applications

The largest obstacle is that existing applications are not geared for immediate use in an MDO. However, many applications are already configurable to work with external “master data”, and this is an extension of that concept. An application will not own any organizational data, in the sense that it is allowed to create or identify such. That responsibility lies within the unified database, much like such responsibility is already outsourced in architectures containing master data management systems (MDM) or entity resolution systems (ERS). 

We can distinguish between five types of data in an organization: 

  1. Configuration data
    Data local to an application, does not define the organization, and determines how the application executes.
  2. Operational data
    Data that resides in the unified database, defines the organization, and is created by the applications.
  3. Third-party data
    Data that resides in or is accessible from the unified database, enriches existing data, and is created by external parties.
  4. Supervisory data
    Data that resides in the unified database, assists the maintainers, and internally benchmarks parts of the unified model, created from logs and usage of data.
  5. Analytical data
    Data that resides in the unified database, enlightens the organization, and is derived from operational, third-party, and supervisory data.

Traditional applications work with the first two types, configuration and operational data. External, analytical, and supervisory have traditionally been the concern of analysts in conjunction with data engineers or data warehouse architects. At a bare minimum, applications tailored to support an MDO can keep configuration data local but must externalize all operational data. We believe that future applications built specifically for an MDO are likely to incorporate all five types to various degrees, depending on which use cases the applications serve.

The access patterns for the types of data listed also vary. Operational data is typically characterized by work done in small chunks and with high concurrency, whereas analytical data is work done in large chunks and with low concurrency. We have therefore seen database systems often specializing in managing one or the other type of load, but not both simultaneously. This is now changing, with offerings like SingleStore and Snowflake’s Unistore. Snowflake even aims to provide “native applications”, their own version of an App Store, where it will be possible to buy applications that run locally on your data. 

Benefits of Going MDO

In the problem statement found in part 1, six factors were listed that distance the de facto way of working from the ideal way of working in an organization. We will now show how the MDO will help bring the way of working closer to the ideal.

The goals of the organization exist vaguely and localized to some select individuals. While a traditional organization’s overarching purpose may be well known to its workforce, that purpose is usually hard to translate into the rationales behind the work put into daily operations on an individual level. In the MDO, everyone has a crystal-clear purpose; people’s actions serve the purpose of fetching, modifying, and creating data about a specific concept. It’s clear where to find customer data because all customer data can be found in one place, shepherded by the Customer team. While there isn’t one authority for everything, the team that is responsible for a concept is the one authority for everything related to that concept.

The de-facto way of working is a heritage from a different time. The way of working in the MDO will always reflect the model, and as long as the model is up to date with reality, the risk of not working on what you should be working is greatly reduced. Given that even the organizational structure is tied to the model, this provides a lock-in to the model. You cannot change the business without first changing the model. If activities are discovered that lie outside of what the model dictates, either the model needs to quickly adapt or the activities cease.

The de-facto way of working strays from the ideal because of management fads. Many organizations change their way of working based on current trends in management theory. For the MDO, the way of working is more well defined as it unites the three earlier mentioned dimensions: reality, language, and data. That leaves less room to wiggle in exotic forms of management. Individuals have clear objectives tied to results that show up as data in the unified database. Given how tangible work then becomes, the desire to look for other ways of working should also diminish.

The de-facto way of working is externally incentivized by vendors who benefit from it. Many organizations suffer from various degrees of vendor-locking, limited to what those vendors provide and lagging behind their roadmaps. With reusable model-driven applications, working on a single unified database, the important things for your organization are all under the control of the MDO. What is expressed through the dimensions: reality, language, and data can no longer become opaque in the hands of a vendor. This greatly reduces the power any vendor can hold over an organization. 

The de-facto way of working is a compromise due to technological limitations. When this happens, the organization is either stuck with legacy systems that are near impossible to replace or the organization has requirements that no existing applications can fill. In both of these cases, developing a custom solution should be simpler in an MDO, given that data is already externalized from applications. In-house development will be important for an MDO, especially before the paradigm shift is complete and reusable model-driven applications are commonplace.

The de-facto way of working is sufficient to be profitable. For an already profitable organization, there is little incentive to change, even if the way of working has great inefficiencies. In the MDO, inefficiencies are easier to discover, thanks to the observability of work done through the data that results from that work. If activities lead to no or undesired outcomes, those activities can be spotted more easily. Inefficiencies can thereby be dealt with before they become the norm in the organization.

Conclusion

Whatever you may think of its feasibility with respect to your own organization right now, the model-driven organization is a force to be reckoned with. Given the VUCA (short for volatility, uncertainty, complexity, and ambiguity) world we are living in, having an accurate and up-to-date model of your organization that readily translates into organizational activities and IT systems has become crucial for the success and even the survival of an organization.

For many years, supporting factors like relative global peace, lack of pandemics more seriously than the occasional flu variant, low interest rates and high venture capital investment, meant that organizations could stay afloat without necessarily being very efficient or even profitable. In a comparatively short period of time, these supporting factors have disappeared one by one and probably won’t return for quite some time.

So, for the first time in decades, many organizations really have to know what they are doing, in more than one regard:

  • To be able to react quickly to unforeseen disruptions, you need an accurate and continuously updated, unified model of your organization.
  • Only if you know what is happening and how things are related, you are able to change your way of working, the conceptual buckets into which you put things and the teams in which your employees and colleagues are subdivided fast enough.
  • Only if you can automatically generate new data structure and org structure items as soon as you have recognized the need for a change, you can hit the ground running instead of wasting time and money for extensive transformation projects.
  • And only if you can avoid the usual disconnect between operating model, org structure and data model, you are able to operate efficiently enough to survive as an organization in a time of seriously constrained access to capital.

So, we don’t think it’s an exaggeration to say that adopting the MDO way of working might make the difference between the continued existence of your organization and its untimely demise. We’ll get into more details in parts 3 and 4 of this article series, compare the MDO to other approaches, and hint at a roadmap for adopting it in your organization.

Unstruct

We have just released the very first version of unstruct, v0.1.3. Unstruct is an Open Source program that parses simple XML files into text files, suitable for bulk inserts into a relational database. It is written in Rust and the goal is to be more performant than loading XML into the database and doing the parsing there. As an example, on a recent MacBook Pro unstruct is capable of parsing 10 000 CDR (call detail record) XML files per second.

The release notes are as follows:
This is the very first release of unstruct. Expect bugs. Read the code in place of missing docs.

The code and binaries can be found on GitHub:
https://github.com/Roenbaeck/unstruct

Feel free to fork and help out! We need help:

  • Testing different XML files (very early stages of development).
  • Making it more robust (there’s practically no error handling).
  • Improving it in terms of performance and functionality.

The Return of the JBOT

“A frightful robot wreaking havoc in a city”​ – AI generated art by Midjourney

Back in 2012 data modelers were fighting back an invasion of JBOTs, and I was reporting back from the front lines at various conferences. JBOTs were rapidly taking over our data warehouses, destroying them to the point where they had to be rebuilt from scratch. The average lifetime of a data warehouse was becoming shorter according to scientific studies. In 2012 you could expect a complete rebuild after just over four years, which given the cost of doing so yielded quite poor return of investment. Even so, the necessity of having a data warehouse still saw almost everyone building them and keep struggling. 

We had gotten ourselves into this situation by not adhering to methodologies. Data warehouses either started out with no real enforcement of a methodology or they degraded over time from having more and more deviations. This is understandable. With long lived technological artefacts you are bound to see different people working on them over time. With different people come different ideas, and creativity that extends beyond the set out methodology is rarely a good thing. Soon enough you will have parts that share no resemblance whatsoever and coming from working on one part will in no way help you when you are asked to tend to another part. The JBOT has invaded the data warehouse and transformed it into Just a Bunch Of Tables

In the coming years we largely won the war. The fear of the JBOT became real and widespread. Rebellious new technologies with stronger enforcement of fewer principles became more widely known. Thought leaders were sharing their wisdom and people actually listened. Metadata-driven frameworks helped drive the JBOTs away. Guardians, the data governors, were put in place to stem any uproar before they grew dangerous. We were victorious. But, alas, this victory was not going to be long lasted. 

In the wake of the war, while we were working on refining the methodologies, the JBOTs soon found a new home in the data lake. An idea specifically formed to host and grow JBOTs. While this idea sounded laughable to many of us, it still managed to gain traction. As it turned out, we had gravely underestimated a dark force within businesses – following the path of least resistance. Creating a lake was simple. It requires almost no thought up front. And you have a problem with the lake? Go fish!

As we mobilised to fight the lakes with more or less the same arsenal as before, the JBOTs weaponised themselves with MDS tools. It did not matter that the lakes were swamped by JBOTs and were easy targets to shoot down with proper argumentation. Thanks to the MDS the skill barrier to manufacture JBOTs had suddenly been lowered so much that they started to pop up everywhere. You’ve got data? The JBOT is only a few mouse clicks away. 

It’s 2022. The world is being overrun by JBOTs and I have to return to the front lines. The war is about to start anew and I brace myself for what is to come. How will we win this time? I honestly don’t know. Perhaps we can catch them in a mesh of federated, well governed and methodologically sound data products? Perhaps we can put the model at the core of the business to preclude the JBOTs in the first place? Perhaps this will bring about new discoveries rendering the JBOTs obsolete?

Anyway, just waiting for them to eventually kill themselves and hope that we won’t go down with them is not a part of my plan. 

The JBOT has returned. Join the fight!

Public Models

We are bringing back public models to the Anchor modeling tool. This is still in test and models are loaded from GitHub gists. If you put your model XML (with .xml file extension) in a public gist and make a note of the gist ID, you can call the modeling tool with this ID as a URL parameter. Look at the following URL showing our seed retail model for an example:

https://anchormodeling.com/modeler/test/?gist=edecc0602bd784132cbb6b05a995c8b9

Towards a Model-Driven Organization (Part 1)

Christian Kaul and Lars Rönnbäck

It’s incredible how many years I wasted associating complexity and ambiguity with intelligence. Turns out the right answer is usually pretty simple, and complexity and ambiguity are how terrible people live with themselves.

David Klion (2018)

Many organizations today struggle with a strong disconnect between their understanding of the work they are doing and the way their IT systems are set up.

Data is distributed over a large number of nonintegrated IT systems and manual interfaces (sometimes called “human middleware”) exist between incompatible applications. Within these applications, data may also be subject to regulations, and compliance is difficult to achieve. We can trace most, if not all, of these issues back to an abundance of unspecific, inflexible, and non-aligned data models underlying the applications these organizations use to conduct their business.

In this article, the first in a series, we briefly describe the issues resulting from this disconnect and their origins within a traditional organization. We then suggest a radical shift, to a model-driven organization, where all applications work towards a single data platform with a unified model. Instead of creating models that mirror the existing organization and its dysfunctions, we suggest first creating a unified model based on the goals of the organization, and thereafter derive the organizational structure and the necessary applications from it.

Technologically, databases are now appearing in the market that can manage OLTP (operational) and OLAP (analytical) loads simultaneously, with associated app stores and application development frameworks, thereby enabling organizations to become model-driven.

Motivation

All organizations create data. When you’re using computers (and who isn’t these days), everything you do produces data. Therefore it’s not surprising that data is becoming an ever more important asset to manage.

Pretty much all organizations therefore store data in various shapes and forms. Putting this data to good use is the natural next step on the agenda and organizations that are successful in that respect claim to be data-driven.

The transition from giving little attention to data to becoming data-driven has been gradual, and many businesses have yet to organize themselves around data. Rather, data is predominantly organized around business processes. Unification of the available data is done far downstream, after it has passed through the organizational structure, the people in the different departments, the applications they use, and the databases in which they have stored it.

These databases also have their own application-specific models, creating a disparate data structure landscape that is hard to navigate, and unification of these is usually a resource-intensive and ongoing task in an organization. This leads to confusion, frustration and an often abysmal return on investment for data initiatives.

Processes

Ultimately, organizations have some set of goals they wish to fulfill. These can be goals for the organization itself (profit, market share, etc), but also goals related to their customers (satisfaction, loyalty, etc), their employees (health, efficiency, etc), applicable regulations (GDPR, SOX, etc.), or society as a whole (sustainability, equality, etc.).

The organization then structures itself in some way based on a perception on how to best work on reaching these goals. This perception is often influenced by current management trends, with flavors like functional, matrix, project, composite, and team-based organizational structures. There are also various frameworks associated with these describing ways of working within the organization, such as ITIL, SAFe, Lean, DevOps, and Six Sigma.

The sheer number of flavors and frameworks gaining and falling in popularity should be a warning sign that something is amiss. We believe that all of these treat the symptoms, but neither get at the root cause of the problem.

Technology

A heterogenous application and data store landscape within an organization is a strong detractor from achieving a unified view of the data they contain.

There are a plethora of job titles related to dealing with this heterogeneity: enterprise architect, integration architect, data warehouse architect, and the like. There are also different more or less systematic approaches, such as enterprise messaging systems, microservices, master data management, modern data stack, data mesh, data fabric, data lake, data warehouse, data lakehouse, and so on.

Again, the sheer number of titles and approaches and their gaining and falling in popularity should be a warning sign that something is amiss. We believe that also all of these treat the symptoms, but neither get at the root cause of the problem.

Problem Statement

The problem is that the way an organization is intended to work is usually misaligned with how it actually works, due to a number of factors distancing the ideal way of working from the de-facto way of working.

Some of these factors causing misalignment are:

  • The goals of the organization are vague and fuzzy and localized to some select individuals.
  • The de-facto way of working is a heritage from a different time.
  • The de-facto way of working strays from the ideal because of management fads.
  • The de-facto way of working is externally incentivized by vendors who benefit from it.
  • The de-facto way of working is a compromise due to technological limitations.
  • The de-facto way of working is sufficient to be profitable.

In future articles, we will show how these misalignment factors can be addressed in a model-driven organization, bringing its way of working much closer to the ideal.

We also believe that the significant divide between created data and actionable data found in most organizations is debilitating, since actionable data is what in the end creates value for the organization.

Data and Organizations

While products or services tend to leave the organization, data usually does not. It is the remainder of the daily operations, the breadcrumbs of human activity inside the organization, and as such the source from which an organization may learn, adapt and evolve.

If the collective knowledge of an organization only resides in the memories of its employees, it will never be utilized to its full potential. Even worse, given high record-high turnover (what some call “the great resignation”), this knowledge is leaving the organization at a dangerously high rate. This is especially harmful because it’s usually not the least competent, least experienced people leaving, quite the opposite.

Harnessing the full potential of the knowledge hidden in its data is therefore a necessity in the “survival of the fittest”-style environment most organizations face today. The survival of the organization depends on it, not figuratively but literally. Therefore, the data an organization creates must be stored, and stored in a way that makes it readily actionable.

The Traditional Approach

Looking at the architecture of a traditional organization (Figure 1), the organizational structure is formed to satisfy its goals.

The people working within this organizational structure buy and sometimes build applications that simplify their daily operations or solve specific problems. These applications create data, often stored in some database local to each application.

Data is then integrated from the disparate models found in the many application databases into a single database with a unified model. Analytics based on this unifiedly modeled data help people understand the ongoings in the organization and indicators show whether or not it is on the right track to achieving its goals.

Figure 1: Data within a traditional organization.

In this architecture, there is a divide between created data and actionable data. This divide also reduces the capacity with which the organization can assess its progress towards its goals.

Trying to Make Sense of Your Data

Data is created far from where it is analyzed, and data creation is often governed by third-party applications made for organizations in general, not custom-made for a specific organization.

The models those applications have chosen for the data they create rarely align perfectly with the model of a particular business. In order to align data created by different applications into a unified model of the organization, data must be interpreted, transported, and integrated (the dreaded ELT processes of extracting, loading and transforming data).

Application developers usually face fewer requirements than those a unified model should serve. As an example, there is often little to no support for retaining a history of changes in the application and they show only the current state things are in. Any natural progression or corrections that may have happened just overwrite the existing data. Living up to regulations in which both of these types of changes must be kept historically can significantly raise the complexity of the architecture needed to interpret, transport, and integrate data.

Another aspect that is complicating the architecture is the need for doing near real-time analytics. Interpreting, transporting, and integrating data are time-consuming operations, so achieving zero latency is impossible, not even with a massive increase in the ETL process execution frequency.

Data in the unified model is therefore never immediately actionable. Reducing this lag puts a strain on both the applications and the database serving the unified model, introduces additional challenges when it comes to surveillance and maintenance, and potentially significant cloud compute costs.

Trying to Make Sense of Someone Else’s Model

Applications that are not built in-house are normally built in a way that they are suitable for a large number of organizations. Their database models may therefore be quite extensive, in order to be able to serve many different use cases. These models also evolve with new versions of the applications.

Because of this, it is unusual that all possible data is interpreted, transported, and integrated into the unified model. Instead some subset is selected. Because of new requirements or applications evolving, this subset often has to be revised. Adapting to such changes can consume significant portions of the available time for maintenance of the unified model.

Maintaining a separate database with a unified model also comes with a monetary cost. Staff is needed with specialist skills in building unified models and logic for interpreting, transporting, and integrating data, while also maintaining these over time. On top of that is the cost of keeping a separate database to hold the unified model. Depending on whether this is in the cloud or on premise, there may be different costs associated with licensing, storage, compute, and backups.

Fragmentation

In larger or more complex organizations, the specialists can rarely comprehend and be responsible for all sources, given the number of applications used.

This results in hyper-specialization on some specific sources and tasks, which impairs their ability to understand and deliver on requirements that encompass areas outside of their expertise. Hyper-specialization also increases the risks of having single points of failure within the organization.

Making data actionable in the heterogenous application landscape resulting from the traditional approach outlined above requires a lot of work and carries a significant cost for the organization. There should be a better way and we’re convinced there is one. We’ll go into more detail in the next article in this series.

Large Scale Anchor Modeling

Quoting the video description:

The Data Vault approach gives the data modelers a lot of options to choose from: how many satellites to create, how to connect hubs with links, what historicity to use, which field to use as a business key. Such flexibilites leaves a lot of options for inoptimal modeling decisions.

I want to illustrate some choices (I call them issues) with risks and possible solutions from other modeling techniques, like Anchor Modeling. All issues are based on the years of evolving the Data Vault and Anchor Modeling data warehouses of 100+ TB in such databases as Vertica and Snowflake.

Speaker: Nikolai Golov is Head of Data Engineering of ManyChat (SaaS startup with offices in San Francisco and Yerevan), and a lecturer at Harbour Space University in Barcelona (data storage course). He studies modern data modeling techniques, like Data Vault and Anchor Modeling, and their applicability to big data volumes (tens and hundreds of TB). He also, as a consultant, helps companies to launch their own analytical/data platform.

Recorded at the Data Modeling Meetup Munich (DM3), 2022-07-18 https://www.meetup.com/Data-Modeling-DM3

Also recommended are the additional Medium articles by Anton Poliakov: https://medium.com/@yaschiknamail

Atomic Data

We failed. I recently attended the Knowledge Gap conference, where we had several discussions related to data modeling. We all agreed that we are in a distressful situation both concerning the art as a whole but also its place in modern architectures, at least when it comes to integrated data models. As an art, we are seeing a decline both in interest and schooling, with practitioners shying away from its complexity and the topic disappearing from curriculums. Modern data stacks are primarily based on shuffling data and new architectures, like the data mesh, propose a decentralized organization around data, making integration an even harder task.

When I say we failed, it is because data modeling in its current form will not take off. Sure we have successful implementations and modelers with both expertise and experience in Ensemble Modeling techniques, like Anchor modeling, Data Vault and Focal. There is, however, not enough of them and as long as we are not the buzz, opportunities to actually prove that this works and works well will wane. We tried, but we’re being pushed out. We can push back, and push back harder, but I doubt we can topple the buzzwall. I won’t stop pushing, but maybe it’s also time to peek at the other side of the wall.

If we begin to accept that there will only be a select few who can build and maintain models, but many more who will push data through the stack or provide data products, is there anything we can do to embrace such a scenario?

Data Whisperers

Having given this some thought I believe I have found one big issue, preventing us from managing data in motion as well as we should. Every time we move data around we also make alterations to its representation. It’s like Chinese Whispers (aka the telephone game) in which we are lucky to retain the original message when it reaches the last recipient, given that the message is whispered from each participant to the next. A piece of information is, loosely speaking, some bundle of stuff with a possible semantic interpretation. What we are doing in almost all solutions today is to, best we can, pass on and preserve the semantic interpretation, but care less about the bundle it came in. We are all data whisperers, but in this case that’s a bad thing.

Let’s turn this around. What if we could somehow pass a bundle around without having to understand the possible semantic interpretation? In order to do that, the bundle would have to have some form that would ensure it remained unaltered by the transfer, and that defers the semantic interpretation. Furthermore, whatever is moving such bundles around cannot be surprised by their form (read like throwing an exception), so this calls for a standard. A standard we do not have. There is no widely adopted standard for messaging pieces of information, and herein lies much of the problem.

The Atoms of Data

Imagine it was possible to create atoms of data. Stable, indivisible pieces of information that can remain unchanged through transfer and duplication, and that can be put into a grander context later. The very same piece could live in a source system, or in a data product layer, or in a data pipeline, or in a data warehouse, or all of the above, looking exactly the same everywhere. Imagine there was both a storage medium and a communication protocol for such pieces. Now, let me explain how this solves many of the issues we are facing.

Let’s say you are only interested in shuffling pieces around. With atomic data pieces you are safe from mangling the message on the way. Regardless of how many times you have moved a piece around, it will have retained its original form. What could have happened in your pipelines though, is that you have dressed up your pieces with additional pieces. Adding context on the way.

Let’s say your are building an integrated enterprise-wide model. Now you are taking lots of pieces and want to understand how these fit into an integrated data model. But, the model itself is also information, so it should be able to be described using some atoms of its own. The model becomes a part of your sea of atoms, floating alongside the pieces it describes. It is no longer a piece of paper printed from some particular modeling tool. It lives and evolves along with the rest of your data.

Let’s say you are building a data product in a data mesh. Your product will shuffle pieces to data consumers, or readers may be a better word, since pieces need not be destroyed at the receiving side. Some of them may be “bare” pieces, that have not yet been dressed up with a model, some may be dressed up with a product-local model and some may have inherited their model from an enterprise-wide model. Regardless of which, if two pieces from different products are identical, they represent the same piece of information, modeled or not.

Model More Later

Now, I have not been entirely truthful in my description of the data atoms. Passing messages around in a standardized way needs some sort of structure, and whatever that structure consists of must be agreed upon. The more universal such an agreement is, the better the interoperability and the smaller the risk of misinterpreting the message. What exactly this is, the things you have to agree upon, is also a model of sorts. In other words, no messaging without at least some kind of model.

We like to model. Perhaps we even like to model a little bit too much. Let us try to forget about what we know about modeling for a little while, and instead try to find the smallest number of things we have to agree upon in order to pass a message. What, similar to a regular atom, are the elementary particles that data atoms consist of? If we can find this set of requirements and it proves to be smaller than what we usually think of when it comes to modeling, then perhaps we can model a little first and model more later.

Model Little First

As it happens, minimal modeling has been my primary interest and topic of research for the last few years. Those interested in a deeper dive can read up on transitional modeling, in which atomic data pieces are explored in detail. In essence, the whole theory rests upon a single structure; the posit.

posit_thing [{(X_thing, role_1), ..., (Y_thing, role_n)}, value, time]

The posit acts as an atomic piece of data, so we will use it to illustrate the concept. It consists of some elements put together, for which it is desired to have a universal agreement, at least within the scope in which your data will be used.

  • There is one or more things, like X_thing and Y_thing, and the posit itself is a thing.
  • Each thing takes on a role, like role_1 to role_n, indicating how these things appear.
  • There is a value, which is what appears for the things taking on these roles.
  • There is a time, which is when this value is appearing.

Things, roles, values, and times are the elements of a posit, like elementary particles build up an atom. Of these, roles need modeling and less commonly, if values or times can be of complex types, they may also need modeling. If we focus on the roles, they will provide a vocabulary, and it is through these posits later gain interpretability and relatability to real events.

p01 [{(Archie, beard color)}, "red", '2001-01-01']
p02 [{(Archie, husband), (Bella, wife)}, "married", '2004-06-19']

The two posits above could be interpreted as:

  • When Archie is seen through the beard color role, the value “red” appears since ‘2001-01-01’.
  • When Archie is seen through the husband role and Bella through the wife role, the value “married” appears since ‘2004-06-19’.

Noteworthy here is that both what we traditionally separate into properties and relationships is managed by the same structure. Relationships in transitional modeling are also properties, but that take several things in order to appear.

Now, the little modeling that has to be done, agreeing upon which roles to use is surely not an insurmountable task. A vocabulary of roles is also easy to document, communicate and adhere to. Then, with the little modeling out of the way, we’re on to the grander things again.

Decoupling Classification

Most modeling techniques, at least current ones, begin with entities. Having figured out the entities, a model describing them and their connections is made, and only after this model is rigidly put into database, things are added. This is where atomic data turns things upside down. With atomic data, lots of things can be added to a database first, then at some later point in time, these can be dressed up with more context, like an entity-model. The dressing up can also be left to a much smaller number of people if desired (like integration modeling experts).

p03 [{(Archie, thing), (Person, class)}, "classified", '1989-08-20']

After a while I realize that I have a lot of things in the database that may have a beard color and get married, so I decide to classify these as Persons. Sometime later I also need to keep track of Golf Players.

p04 [{Archie, thing), (Golf Player, class)}, "classified", '2010-07-01']

No problem here. Multiple classifications can co-exist. Maybe Archie at some point also stops playing golf.

p05 [{(Archie, thing), (Golf Player, class)}, "declassified", '2022-06-08']

Again, not a problem. Classification does not have to be static. While a single long-lasting classification is desirable, I believe we have put too much emphasis on static entity-models. Loosening up classification, so that a thing can actually be seen as more than one type of entity and that classifications can expire over time will allow for models being very specific, yield much more flexibility and extend the longevity of kept data far beyond what we have seen so far. Remember that our atomic pieces are unchanged and remain, regardless of what we do with their classifications.

Multitenancy

Two departments in your organization are developing their own data products. Let us also assume that in this example it makes sense for one department to view Archie as a Person and for the other to view Archie as a Golf Player. We will call the Person department “financial” and it additionally needs to keep track of Archie’s account number. We will call the Golf Player department “member” and it additionally needs to keep track of Archie’s golf handicap. First, the posits for the account number and golf handicap are:

p06 [{(Archie, account number)}, 555-12345-42, '2018-01-01']
p07 [{(Archie, golf handicap)}, 36, '2022-05-18']

These posits may live their entire lives in the different data products and never reside together, or they could be copied to temporarily live together for a particular analysis, or they could permanently be stored right next to each other in an integrated database. It does not matter. The original and any copies will remain identical. With those in place, it’s time to add information about the way each department view these.

p08 [{(p03, posit), (Financial Dept, ascertains)}, 100%, '2019-12-31']
p09 [{(p04, posit), (Member Dept, ascertains)}, 100%, '2020-01-01']
p10 [{(p06, posit), (Financial Dept, ascertains)}, 100%, '2019-12-31']
p11 [{(p07, posit), (Member Dept, ascertains)}, 75%, '2020-01-01']

The posits above are called assertions, and they are metadata, since they talk about other posits. Information about information. An assertion records someone’s opinion of a posit and the value that appears is the certainty of that opinion. In the case of 100%, this corresponds to absolute certainty that whatever the posit is stating is true. The Member Department is less certain about the handicap, perhaps because the source of the data is less reliable.

Using assertions, it is possible to keep track of who thinks what in the organization. It also makes it possible to have different models for different parts of the organization. In an enterprise wide integrated model, perhaps both classifications are asserted by the Enterprise Dept, or some completely different classification is used. You have the freedom to do whatever you want.

Immutability

Atomic data only works well if the data atoms remain unchanged. You would not want to end up in a situation where a copy of a posit stored elsewhere than the original all of a sudden looks different from it. Data atoms, the posits, need to be immutable. But, we live in a world where everything is changing, all the time, and we are not infallible, so mistakes can be made.

While managing change and immutability may sound like incompatible requirements, it is possible to have both, thanks to the time in the posit and through assertions. Depending on if what you are facing is a new version or a correction it is handled differently. If the beard of Archie turns gray, this is a new version of his beard color. Recalling the posit about its original color and this new information gives us the following posits:

p01 [{(Archie, beard color)}, "red", '2001-01-01']
p12 [{(Archie, beard color)}, "gray", '2012-12-12']

Comparing the two posits, a version (or natural change), occurs when they have the same things and roles, but a different value at a different time. On the other hand, if someone made a mistake entering Archie’s account number, this needs to be corrected once discovered. Let’s recall the posit with the account number and the Financial Dept’s opinion, then add new posits to handle the correction.

p06 [{(Archie, account number)}, 555-12345-42, '2018-01-01']
p10 [{(p06, posit), (Financial Dept, ascertains)}, 100%, '2019-12-31']
p13 [{(p06, posit), (Financial Dept, ascertains)}, 0%, '2022-06-08']
p14 [{(Archie, account number)}, 911-12345-42, '2018-01-01']
p15 [{(p14, posit), (Financial Dept, ascertains)}, 100%, '2022-06-08']

This operation is more complicated, as it needs three new posits. First, the Financial Dept retracts its opinion about the original account number by changing its opinion to 0% certainty; complete uncertainty. For those familiar with bitemporal data, this is sometimes there referred to as a ‘logical delete’. Then a new posit is added with the correct account number, and this new posit is asserted with 100% certainty in the final posit.

Immutability takes a little bit of work, but it is necessary. Atoms cannot change their composition without becoming something else. And, as soon as something becomes something else, we are back to whispering data and inconsistencies will abound in the organization.

What’s the catch?

All of this looks absolutely great at first glance. Posits can be created anywhere in the organization provided that everyone is following the same vocabulary for the roles, after which these posits can be copied, sent around, stored, classified, dressed up with additional context, opinionated, and so on. There is, however, one catch.

Identifiers.

In the examples above we have used Archie as an identifier for some particular thing. This identifier needs to have been created somewhere. This somewhere is what owns the process of creating other things like Archie. Unless this is centralized or strictly coordinated, posits about Archie and Archie-likes cannot be created in different places. There should be a universal agreement on what thing Archie represents and no other thing may be Archie than this thing.

More likely, Archie would be stated through some kind of UID, an organizationally unique identifier. Less readable, but more likely the actual case would be:

p01 [{(9799fcf4-a47a-41b5-2d800605e695, beard color)}, "red", '2001-01-01']

The requirement for the identifier of the posit itself, p01, is less demanding. A posit depends on each of its elements, so if just one bit of a posit changes, it is a different posit. The implication of this is that identifiers for posits need not be universally agreed upon, since they can be resolved within a body of information and recreated at will. Some work has to be done when reconciling posits from several sources though. We likely do not want to centralize the process of assigning identities to posits, since that would mean communicating every posit from every system to some central authority, more or less defeating the purpose of decentralization.

Conclusions

If we are to pull off something like the data mesh, there are several key features we need to have:

  • Atomic data that can be passed around, copied, and stored without alteration.
  • As few things as possible that need to be universally agreed upon.
  • Model little first model more later, dress up data differently by locality or time.
  • Immutability so that data remains consistent across the organization.
  • Versions and corrections, while still adhering to immutability.
  • Centralized management for the assignment of identifiers.

As we have seen, getting all of these requires carefully designed data structures, like the posit, and a sound theory of how to apply them. With the work I have done, I believe we have both. What is still missing are the two things I asked you to imagine earlier, a storage medium and a communication protocol. I am well on the way to produce a storage medium in the form of the bareclad database engine, and a communication protocol should not be that difficult, given that we already have a syntax for expressing posits, as in the examples above.

If you, like me, think this is the way forward, please consider helping out in any way you can. The goal is to keep everything open and free, so if you get involved, expect it to be for the greater good. Get in touch!

We may have failed. But all is definitely not lost.

Information in Effect and Performance

Last week we had some performance issues in a bitemporal model, which by the looks of it was the result of a poorly selected execution plan in SQL Server. The reasoning behind this conclusion was that if parts of the query were first run separately with results stored in temp tables, and these later used, the issues were gone. This had me thinking though: Could something be done in order to get a better plan through the point-in-time views?

I first set about testing different methods of finding the row in effect in a unitemporal solution. In order to do so, a script was put together that creates a test bench along with a number of functions utilizing different methods. This is the script in case you would like to reproduce the test. Note that some tricks had to be employed for some methods in order to retain table elimination, a crucial feature, that may very well have skewed those results towards the negative.

The best performers in this test are the “OUTER APPLY” and “TOP 1 SUBSELECT”. We are already using the “TOP 1 SUBSELECT” variant, and they are almost tied for first place, so perhaps not much can be gained after all. That said, the execution pattern is very different between the two, so it’s hard to draw any conclusions without proper testing for the bitemporal case.

In the bitemporal point-in-time views, the rows in effect method has to be used twice. First to find the latest asserted posits, and then from those, the ones with the latest appearance time. So, I set about testing the four possible combinations of the two best approaches on one million rows in an example model. The results are summarized below (you may need to click to enlarge the images unless you have a really good monitor and incredible eye sight).

TOP 1 SUBSELECT appearance TOP 1 SUBSELECT assertion

Time to run: 8.0 seconds. This is the current approach.

OUTER APPLY appearance OUTER APPLY assertion

Time to run: 5.1 seconds. Better than current, even if the estimated cost is worse.

TOP 1 SUBSELECT appearance OUTER APPLY assertion

Time to run: 9.5 seconds. Worse than current.

OUTER APPLY appearance TOP 1 SUBSELECT assertion

Time to run: 3.9 seconds. Better than current, and lower estimated cost.

Results

The last of the alternatives above cuts the execution time in half for the test we ran. It also has the simplest execution plan of them all. This seems promising, given that our goal was to get the optimizer to pick a good plan in a live and complex environment. I will be rewriting the logic in the generator for bitemporal models during the week to utilize this hybrid method of OUTER APPLY and TOP 1 SUBSELECT.