In my previous article “What needs to be agreed upon“, from my series about #transitional modeling, I listed the few things that must be interpreted equally among those sharing information between them. To recall, these were identities, values, roles, and time points. If we do not agree upon these, ambiguities arise, and it is no longer certain that we are talking about the same thing. We used this to create the fundamental construct in transitional modeling; the posit, which is a “triple” on the form [{(id¹, role¹), …, (idᴺ, roleᴺ)}, value, time point]. The set in the first position is called an appearance set, and each ordered pair in such a set is called an appearance. An appearance consists of an identity and a role and they will be the topic of this article.
What is interesting and different from most other modeling techniques, is that what the identities represent may be subject to discussion. Two individuals exchanging information in transitional form may disagree on the classifications of the things they discuss. It does not matter if the identity 42 is thought of as a ‘Living Thing’ by one, a ‘Human’ by another, a ‘Person’ by a third, a ‘Customer’ by a fourth, a ‘Fashionista’ by a fifth, an ‘Animate Object’ by a sixth, a ‘Transaction Agent’ by a seventh, and so on. Classifications are just subjective labels in transitional modeling. The glaring issue here is that almost every other modeling technique use class diagrams in the modeling process, but a class diagram presumes that classification is objective. That each and every individual that will ever gaze upon the diagram is in complete agreement that the things it model follow that particular scheme.
Since classification is subjective in transitional modeling, its modeling process must start elsewhere. We need to toss class diagrams in the bin. That is painful for someone who has spent the better part of his life drawing and implementing such diagrams, or in other words, me. With classes in the bin, what remains that can be visualized? To begin with, it must be among the concepts that needs to be agreed upon, that which is objective. Those are the four previously mentioned; identities, values, roles, and time points. Let us look at some posits about a few things, and as it turns out, through these things we shall learn.
- [{(42, beard color)}, black, 2001-01-01]
- [{(42, hair color)}, black, 2001-01-01]
- [{(42, height)}, 187cm, 2019-08-20 08:00]
- [{(42, social security number), OU812-U4IA-1337, 1972-08-20]
- [{(42, name)}, Lazarus, 1972-09-21]
- [{(42, owner), (555, pet), currently owning, 2017-08-10]
- [{(555, name)}, Jacqueline, 2017-06-07]
- [{(555, hair color)}, brown, 2017-06-07]
- [{(555, RFID)}, 4F422275334835423F532C35, 2017-06-07]
I am sure your imagination has already filled in a few blanks, given the posits above. We will try to disregard that. In order to produce a visualization, we first need to find something common between these posits. Looking closer at the appearances, some of the roles (in bold) appear more than once. Let us write down the roles, and in the case of relational posits, the combination of roles separated by commas.
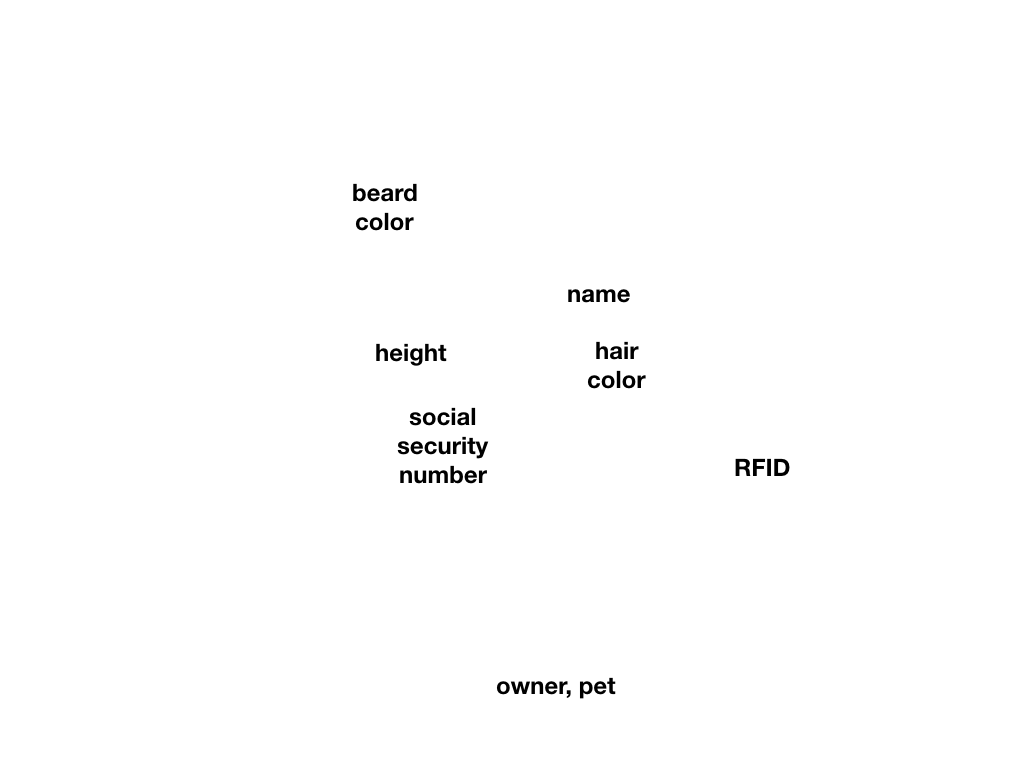
Since what roles mean, the semantics, is necessarily objective in transitional modeling, they make for a good start in a diagram. The diagram above tells us that the things we will be modeling may appear together with these roles. The meaning of each role should be detailed in some other documentation, unless entirely obvious. To me, RFID is something I have a shallow understanding of, so I had to look up the number format online, for example. For our purposes, it’s sufficient to know that it may act as an identifier and can be biologically implanted and later scanned.
So far, the diagram does not give us anything with respect to how these roles appear for our things. Looking back at the list of posits, we can also see that identities appear more than once as well. They will therefore be our second candidate to diagram. We could put the numbers 42 and 555 (actual identities) in the diagram and connect the numbers to the roles in which they appear. This approach, however, only works when you have a very limited number of identities. The diagram, although very expressive, will quickly turn into a confusing snarl, completely defeating its purpose. Since this approach breaks down for a large number of posits, let’s assume that we have a few thousand posits similar to the ones above, in which many different identities appear.
Rather than to diagram the individual identities, what if we could use some aggregate? Let us try with a simple count of unique identities. The count could be written down next to each role. Let’s say that name appears with 5800 unique identities, hair color with 5800, height with 5000, social security number with 5000, beard color with 1450, and RFID with 750. We are getting somewhere now, but there are still redundancies. The count is the same for some of the roles, so why should we write them down more than once? This is where it struck me that these counts behave somewhat like altitudes and that the roles we’ve written down behave somewhat like geographical regions. But, if that is the case, then there is already a type of diagram suitable to display such information; a contour map.
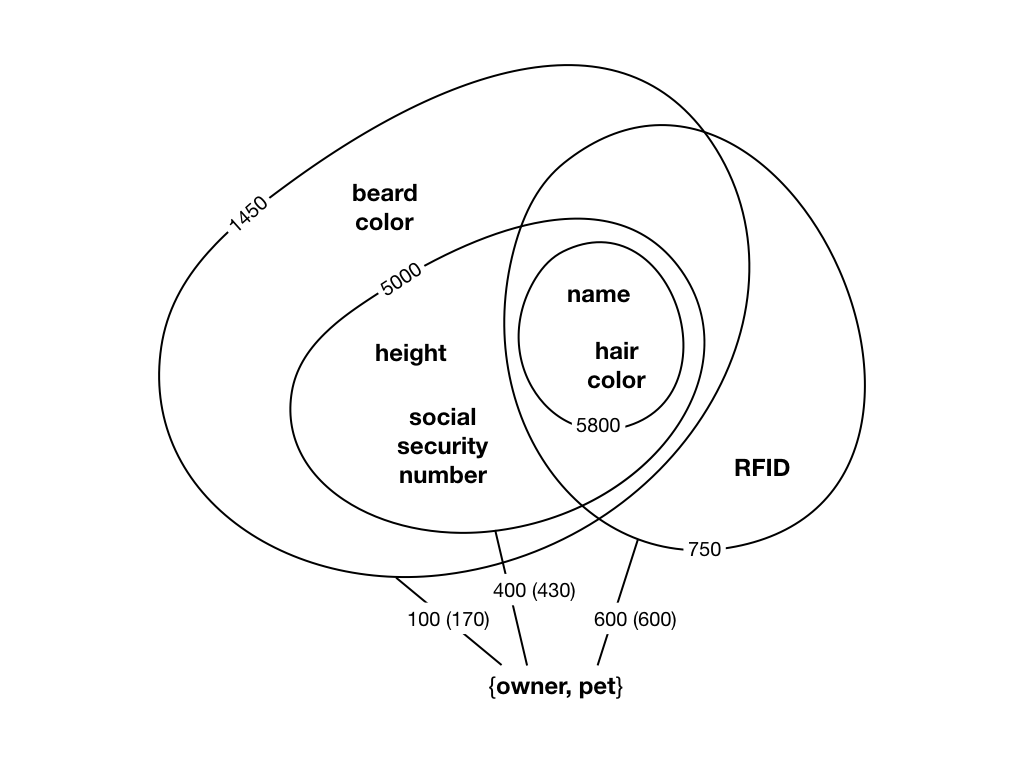
This diagram uses isopleths to create areas with the same counts. From this it is easy to see that more things appear with a name and hair color than things that appear with height and a social security number. All things that appear with the latter two roles also appear with the former two, though. We can also immediately tell that no things have both an RFID and a social security number. The observant reader will have noticed that the relational posit with the combination of the roles {owner, pet} was left out of the counting in the previous step. This was a deliberate act, since I want to make its description richer. The reasoning being that cardinality could be estimated if both actual counts and unique counts are depicted. Please note that even if this particular posit represents a binary relationship, transitional modeling is in no way limited and may have arbitrarily many roles in a single relationship. For such, every cardinality constraint can be expressed, subjectively.
The {owner, pet} role combo does not lend itself very well to the altitude analogy. The additional isopleths would cut through its midst and confuse, rather than enlighten, the viewer. They rather say something about the isopleths themselves, and how these relate to each other. In a more traditional fashion, these will be drawn using lines, connecting the individual roles in the combo with a number of isopleths. From the diagram, we can now see that 600 of the 750 unique things appear in the pet role. The total count, in parentheses, is also 600, so they must appear exactly once. The owner role is different. There are 100 bearded owners, that own a total of 170 pets, and 400 lacking a beard, owning 430 pets. In other words, some owners own more than one pet.
With this knowledge in place, me, subjectively is starting to think about what these things actually are. It is also somewhat obvious where the boundaries between the classifications are. This is the act of classification, finding the boundaries between similar and dissimilar things. I may then proceed to define two classes; Person and Animal, as depicted below.
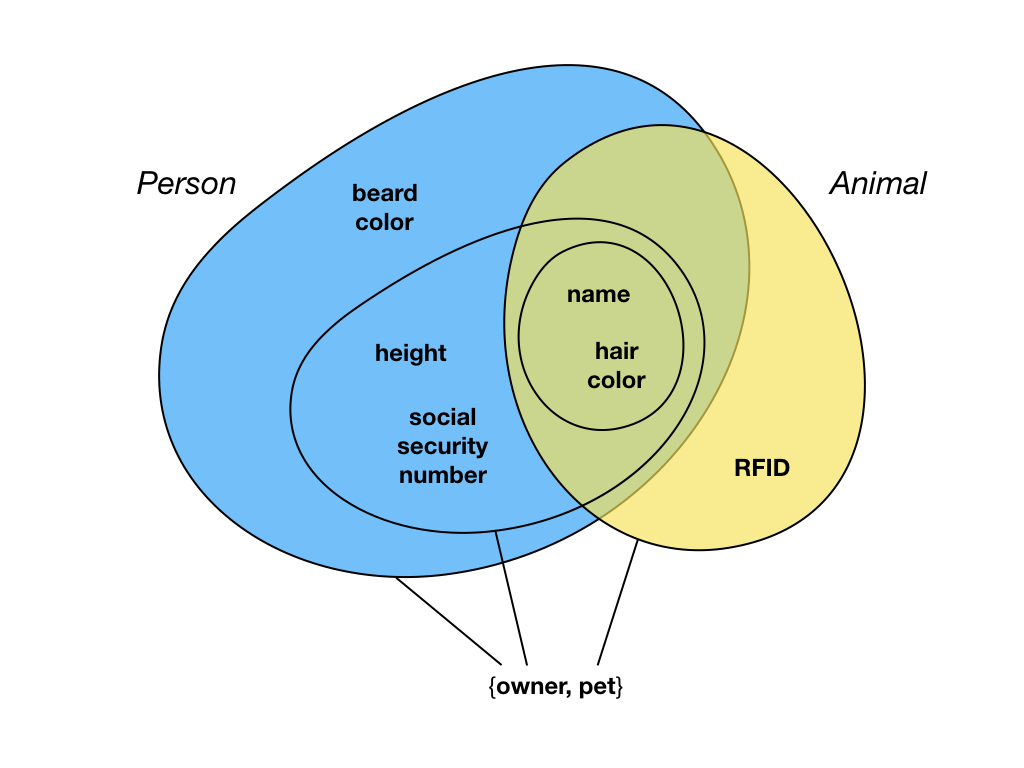
Both classes have name and hair color attributes, but there are also attributes unique to the classes, such as RFID for Animal. It is important to remember that this is my classification. Renaming the classes to Insurer and Insured will not change the things themselves in any way, and it is an equally valid and simultaneously possible classification. Changing the classes (and the coloring) to Chipped and Unchipped, depending on whether an RFID tag had been implanted or not, is also equally valid. However, a classification in which the coloring would no longer be contained by isopleths is not valid. For example, a Male and Female classification is invalid. Why? Unless all males have beards, the color for Malewould have to be present in both the 5000 and 1450 count isopleths, thereby breaking the rule I just instated. The reason is that classification is not unrelated to the information at hand. If another attribute, gender, is added, the necessary isopleths will form, and such a classification will become possible. In other words, classifications may not encode information that is not already present in the model.
While the contour map is objective, its coloring according to classifications is not. So, if and when a modeling tool is built for transitional modeling, it needs to have a way to select a particular subjective perspective to see its classification. It doesn’t stop there though. It would also need a slider, so you could view the isopleths at different times, to see how they have evolved over time. Every posit may also not be asserted by everyone, so again the subjective perspective may need to come into play earlier. It may also be the case that some posits are vaguely asserted, so perhaps yet another slider is needed, to set the minimum reliability to show. Given that this still is early days for transitional modeling, this seems to be a powerful way to achieve a modeling process for it. Nothing is written in stone, and there may be counterexamples where this type of diagram breaks down. I’m very happy to hear your thoughts on the matter!
The idea to use isopleths came from this sketch made by Christian Kaul.
Hi Lars!
Thank you a lot for this article.
The idea is amazing, do you have any idea of implementation of this model?
Best regards,
DM